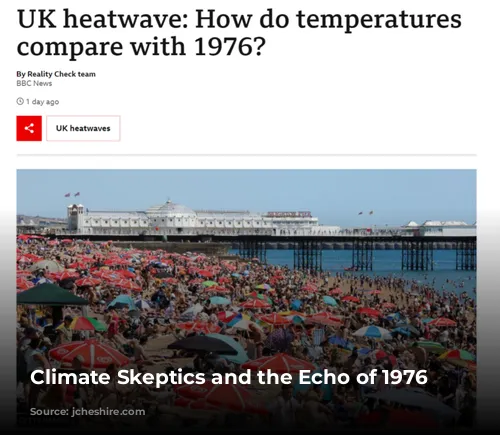
It’s hot. Really hot. So hot, in fact, that the UK is experiencing record-breaking temperatures. And with every new temperature record, a familiar refrain echoes from climate skeptics: “It was this hot in 1976!” This claim, however, is simply not true. While 1976 was indeed a warm year in the UK, the planet as a whole was not as hot then as it is now.
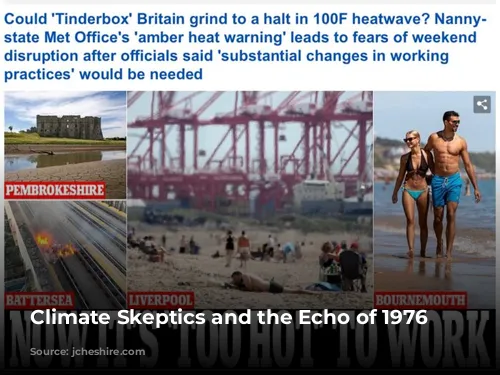
The media’s role in this narrative is significant. I noticed how quickly headlines shifted from questioning the severity of the situation to proclaiming “this is really serious” as temperatures soared and fires erupted. This dramatic shift in media tone highlights the influence of events on public perception.
The 1976 Drought: Media’s Influence on Collective Memory
This shift in media focus got me pondering a map I encountered in a book titled Atlas of Drought in Britain 1975-1976 at the UCL Geography map library. Amongst maps illustrating water demands and groundwater levels, one map stood out—it depicted the “newspaper perception” of the drought.
Extreme weather events, like the 1975-1976 drought, can be studied objectively using scientific methods. However, how the public perceives the significance of a specific weather period hinges on the spread of information and how the press, radio, and television portray these physical events.
This is particularly interesting considering how ingrained “the heatwave of 1976” is in the UK’s collective memory, thanks to constant reminders from the media.
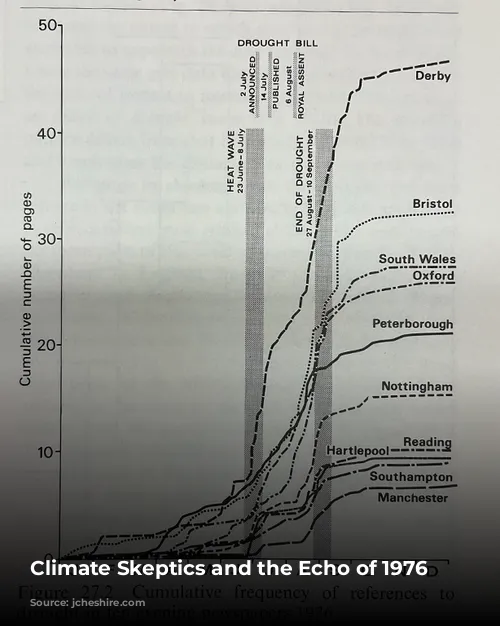
To quantify this media interest, a researcher named Gregory measured the column inches dedicated to the drought in various publications. A front-page story received a higher score than the same story appearing on page 20, for example.
Using this system, Gregory created a map showcasing media interest over time across nine regions of England and Wales.
Media’s Response to the 1976 Drought: A Three-Phase Narrative
Gregory identified three distinct phases in the media’s reaction to the drought:
- Legacy of Below-Average Rainfall: The winter of 1975/76 saw below-average rainfall, raising concerns about low reservoir levels, particularly in South Wales.
- The Heatwave Hits: Late June and early July 1976 saw a scorching heatwave, with shade temperatures exceeding 32 degrees Celsius for two weeks. This period marked a surge in media coverage.
- Drought’s Impact Becomes Clear: By August, the severity of the drought became evident, leading to a peak in media interest.
Interestingly, Gregory noted geographical variations in the duration and timing of media coverage. For instance, regions with groundwater supplies, like Southampton and Reading, quickly moved past the drought in the autumn of 1976, while areas like Derby continued to grapple with near-empty reservoirs.
The graph below illustrates the rise and fall of media interest alongside key events of that year.
A Lost Opportunity for a Modern Analysis?
The rise of the internet and the decline of local media outlets make replicating Gregory’s analysis today impossible. However, it would be fascinating to conduct a similar study to understand how the media in 2022 shapes the collective memory of this record-breaking summer.